Results and Reports
A short explanation of what the numbers mean:
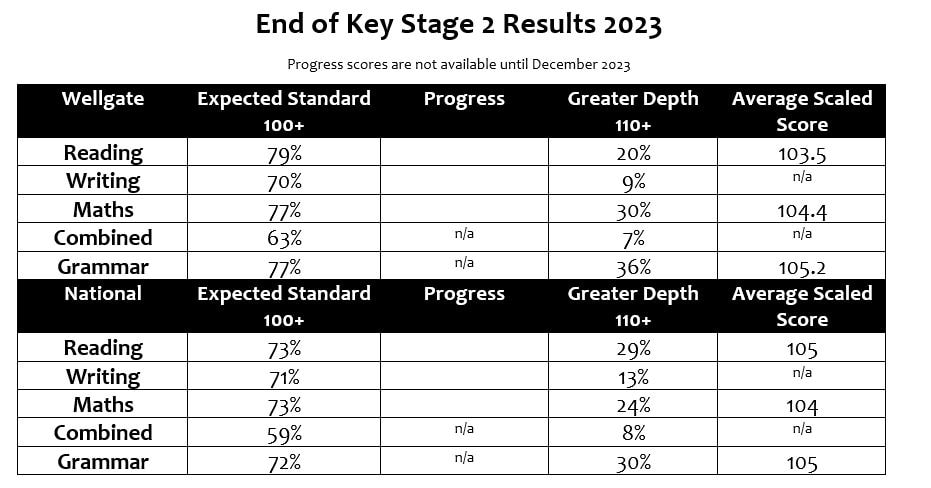
Scaled scores:
In Reading and Maths pupils sit a test which provides a scaled score from 80 to 120. 100 is the expected standard.
Writing is not a test but assessed by the teacher. EXS means the expected standard in Writing.
Combined refers to those pupils who achieved at least 100 in Maths and Reading and EXS or GDS (Greater Depth) in Writing.
110 is classed as a high score in Reading and Maths and Greater Depth is the equivalent in Writing.
More information from the DfE can be found here.
Progress:
Each pupil’s progress is measured by comparing their KS2 scores to pupils with similar KS1 scores from 4 years ago. National average progress scores are 0 and approximately range from -10 to 10.
The 2016 floor standard is -5 for Reading and Maths and -7 for Writing.
Previous SATs RESULTS
Due to the pandemic, the Government has not published KS2 data for 2020, 2021 to 2022 academic years. The last available public data before the academic year of 2022- 2023 is from the 2018 to 2019.
Key Stage 2 Results 2019